The Router rumble: Ars DIY build faces better tests, tougher competition
on
Get link
Facebook
X
Pinterest
Email
Other Apps
Jim Salter
Over the course of 2015, I noticed a
trend. Rather than replacing routers when they literally stopped
working, I increasingly needed to act earlier—swapping in new gear
because an old router could no longer keep up with increasing Internet
speeds available in the area. Famously around the Ars forums, this
problem soon evolved into our homebrew router initiative. In January, I showed my math
as a DIY-Linux router outpaced popular off-the-shelf options like the
Netgear Nighthawk X6 and the Linksys N600 EA-2750. And in August, I
shared the steps necessary to build one of your own.
After readers got a look at the performance charts, I got a ton
of outraged "why didn't you test my favorite brand?!" comments. If you
were one of those skeptics, congrats—today is your day! The Ars homebrew
router special has been coaxed out of retirement to test its speeds
against an entirely new lineup of gear. And to raise the stakes a bit
further, the Ars team has broken out some new and improved methods that
test more hardware and a couple of purpose-designed router distros. This
time, we're even offering power consumption figures as well.
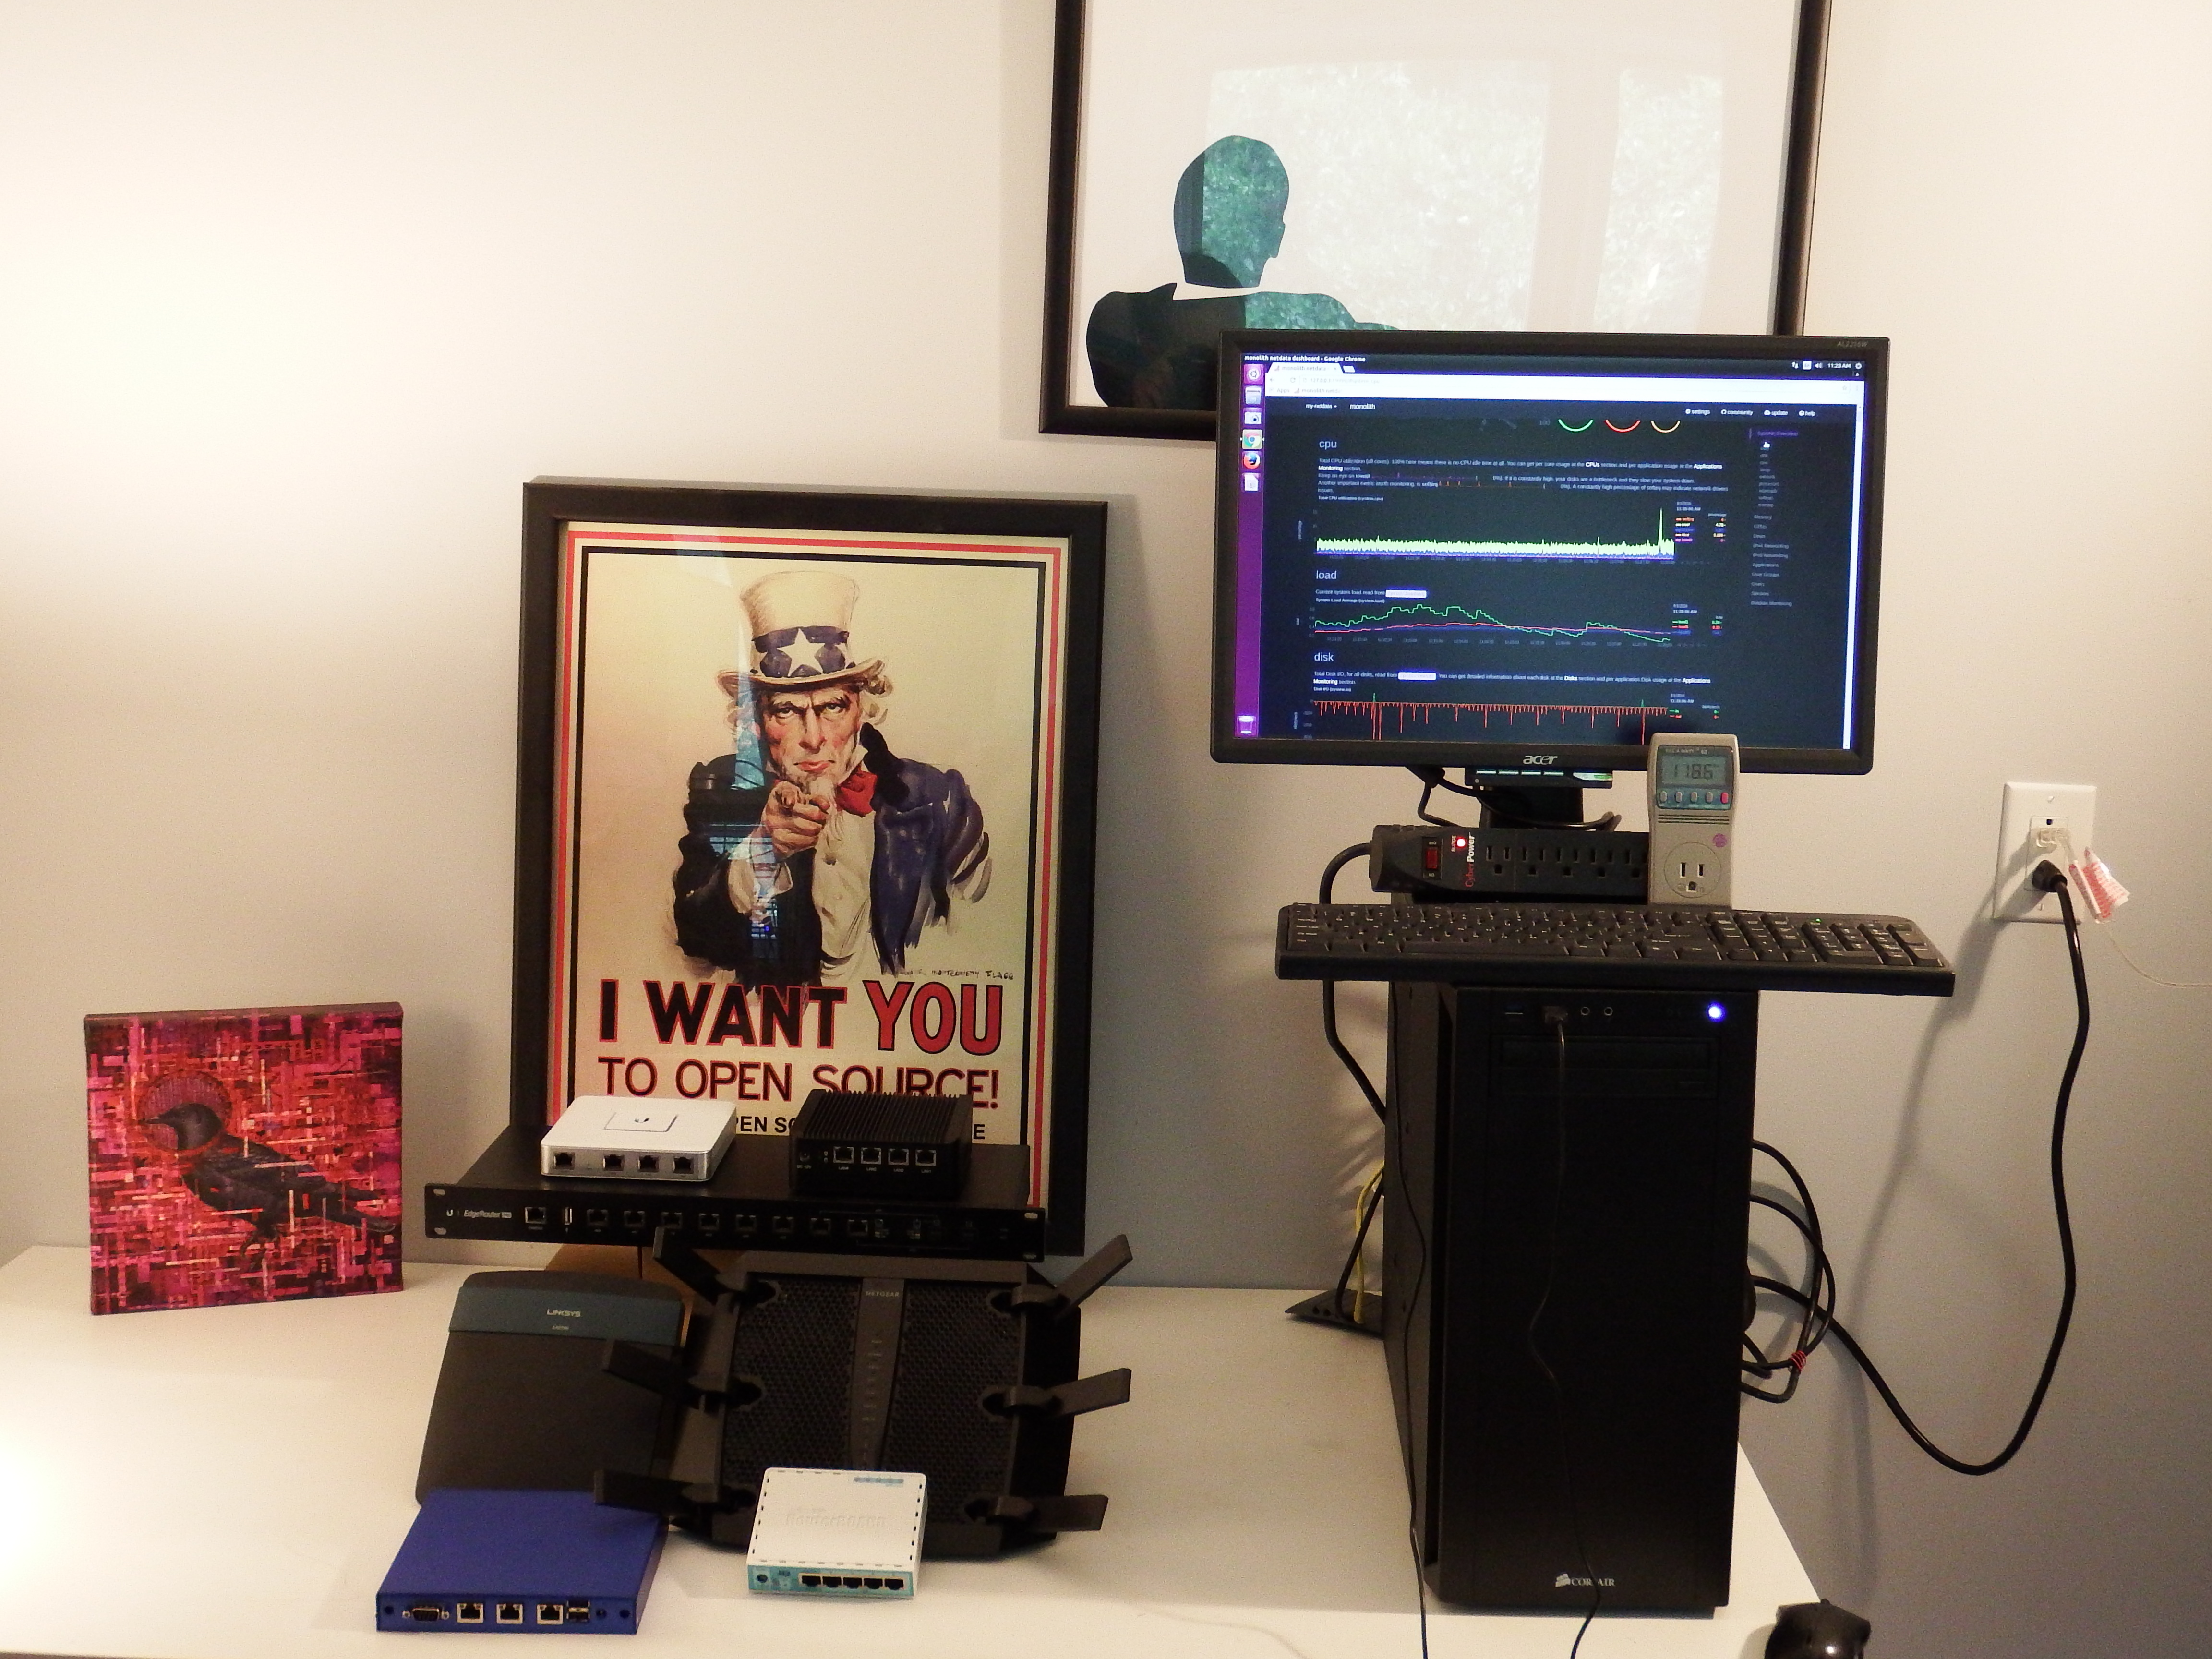
Enlarge/
On the right: our test server Monolith, newly upgraded with an Intel
server-grade gigabit NIC, plus a trusty Kill-A-Watt power meter.
Jim Salter
Methodology updates
For our new and improved testing, we're still
hammering everything with streams of HTTP connections and varying
filesizes. But we've tightened down the time that the HTTP sockets are
allowed to respond (from 240 seconds down to 20) mostly in order to make
prettier graphs. Wait, did I say graphs? (Yes!) This time around, we're
going to look at realtime bandwidth graphs of the testing as it's being
performed, which lets us see
what's happening with the contestants more clearly than we could the
first time around. We'll also look at power consumption for each device,
both idle and under (routing) load. And when we look at raw throughput
numbers, we're going to look solely at completed downloads, since we care more about "how much can we successfully download" rather than "how much useless noise this thing can make on my network."
Enlarge/ For those interested, the pretty realtime bandwidth graphing comes from FireHOL's excellent Netdata project.
Jim Salter
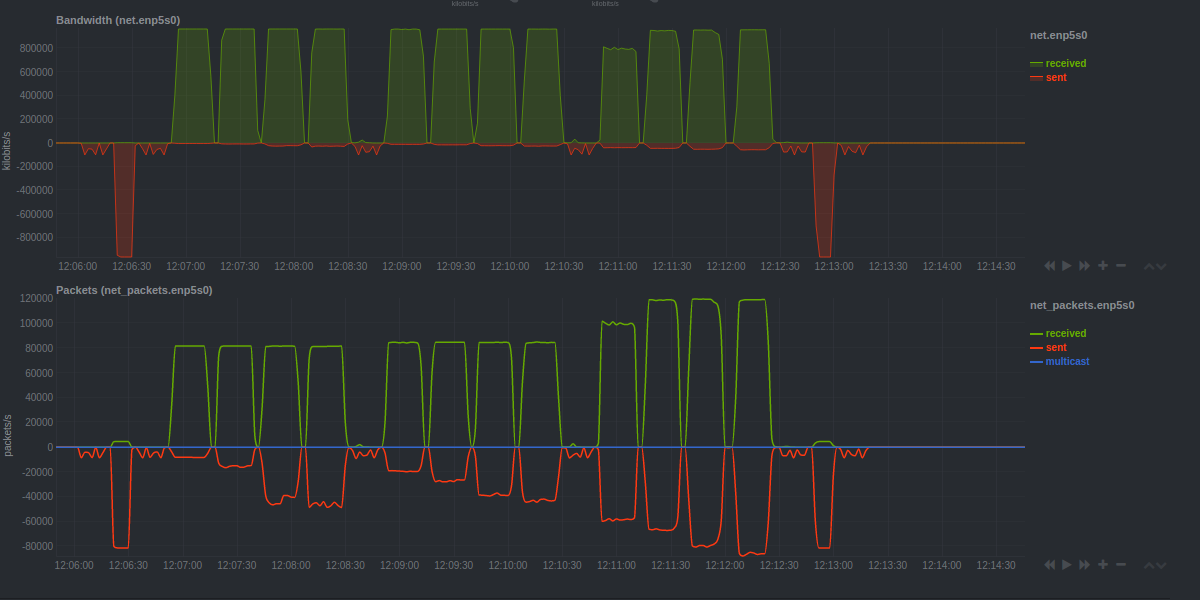
For you analog geeks, think oscilloscope vs.
multimeter—we're looking at realtime graphs of the same types of tests
we performed before. First we test downloading a 1MB file four times:
with 10, then 100, then 1,000, and then 10,000 concurrent clients. Then
we do the same with a 100K file and finally with a 10K file. In general,
the smaller the filesize, the more punishing the test is likely to be
for the router. Smaller filesizes means more and smaller packets,
plus more TCP sessions to make and break. The orange bits bracketing the
tests are "speedbumps" I put in using iperf in order to offset the main
tests and make it visually easier to see what's going on.
The graph above is extremely clean, since it's
a reference run of the test suite across a direct switched network. As
we get to the actual equipment tested, you'll see that it frequently
isn't anywhere near this pretty, and you'll understand why we needed to
break things up visually with simple tests the routers could (mostly)
manage to perform.
I know some readers will ask, so I'm showing
packets per second in this initial reference graph. But for every router
tested, on every run made, the pps graph directly mimicked the
throughput graph at the scales you see here. There were no interesting
differences to be seen, so I won't be showing that data from here on
out.
Each device tested is left as close to an
"out-of-the-box" configuration as possible. All tests are downloads made
by a client on the inside of the router, from a server on the WAN side
of the router, performed across a NAT (Network Address Translation)
layer. "Flood protection" is disabled when and where it appears to be
interfering with test results, but aside from that, no attempt is made
to "tweak" the routers' settings for good or for ill.
Homebrew 2.0
Since the original Homebrew router is in
service for my office now, I built a new one. (Actually, I've built
quite a few new ones since then—they've proven pretty popular.) The
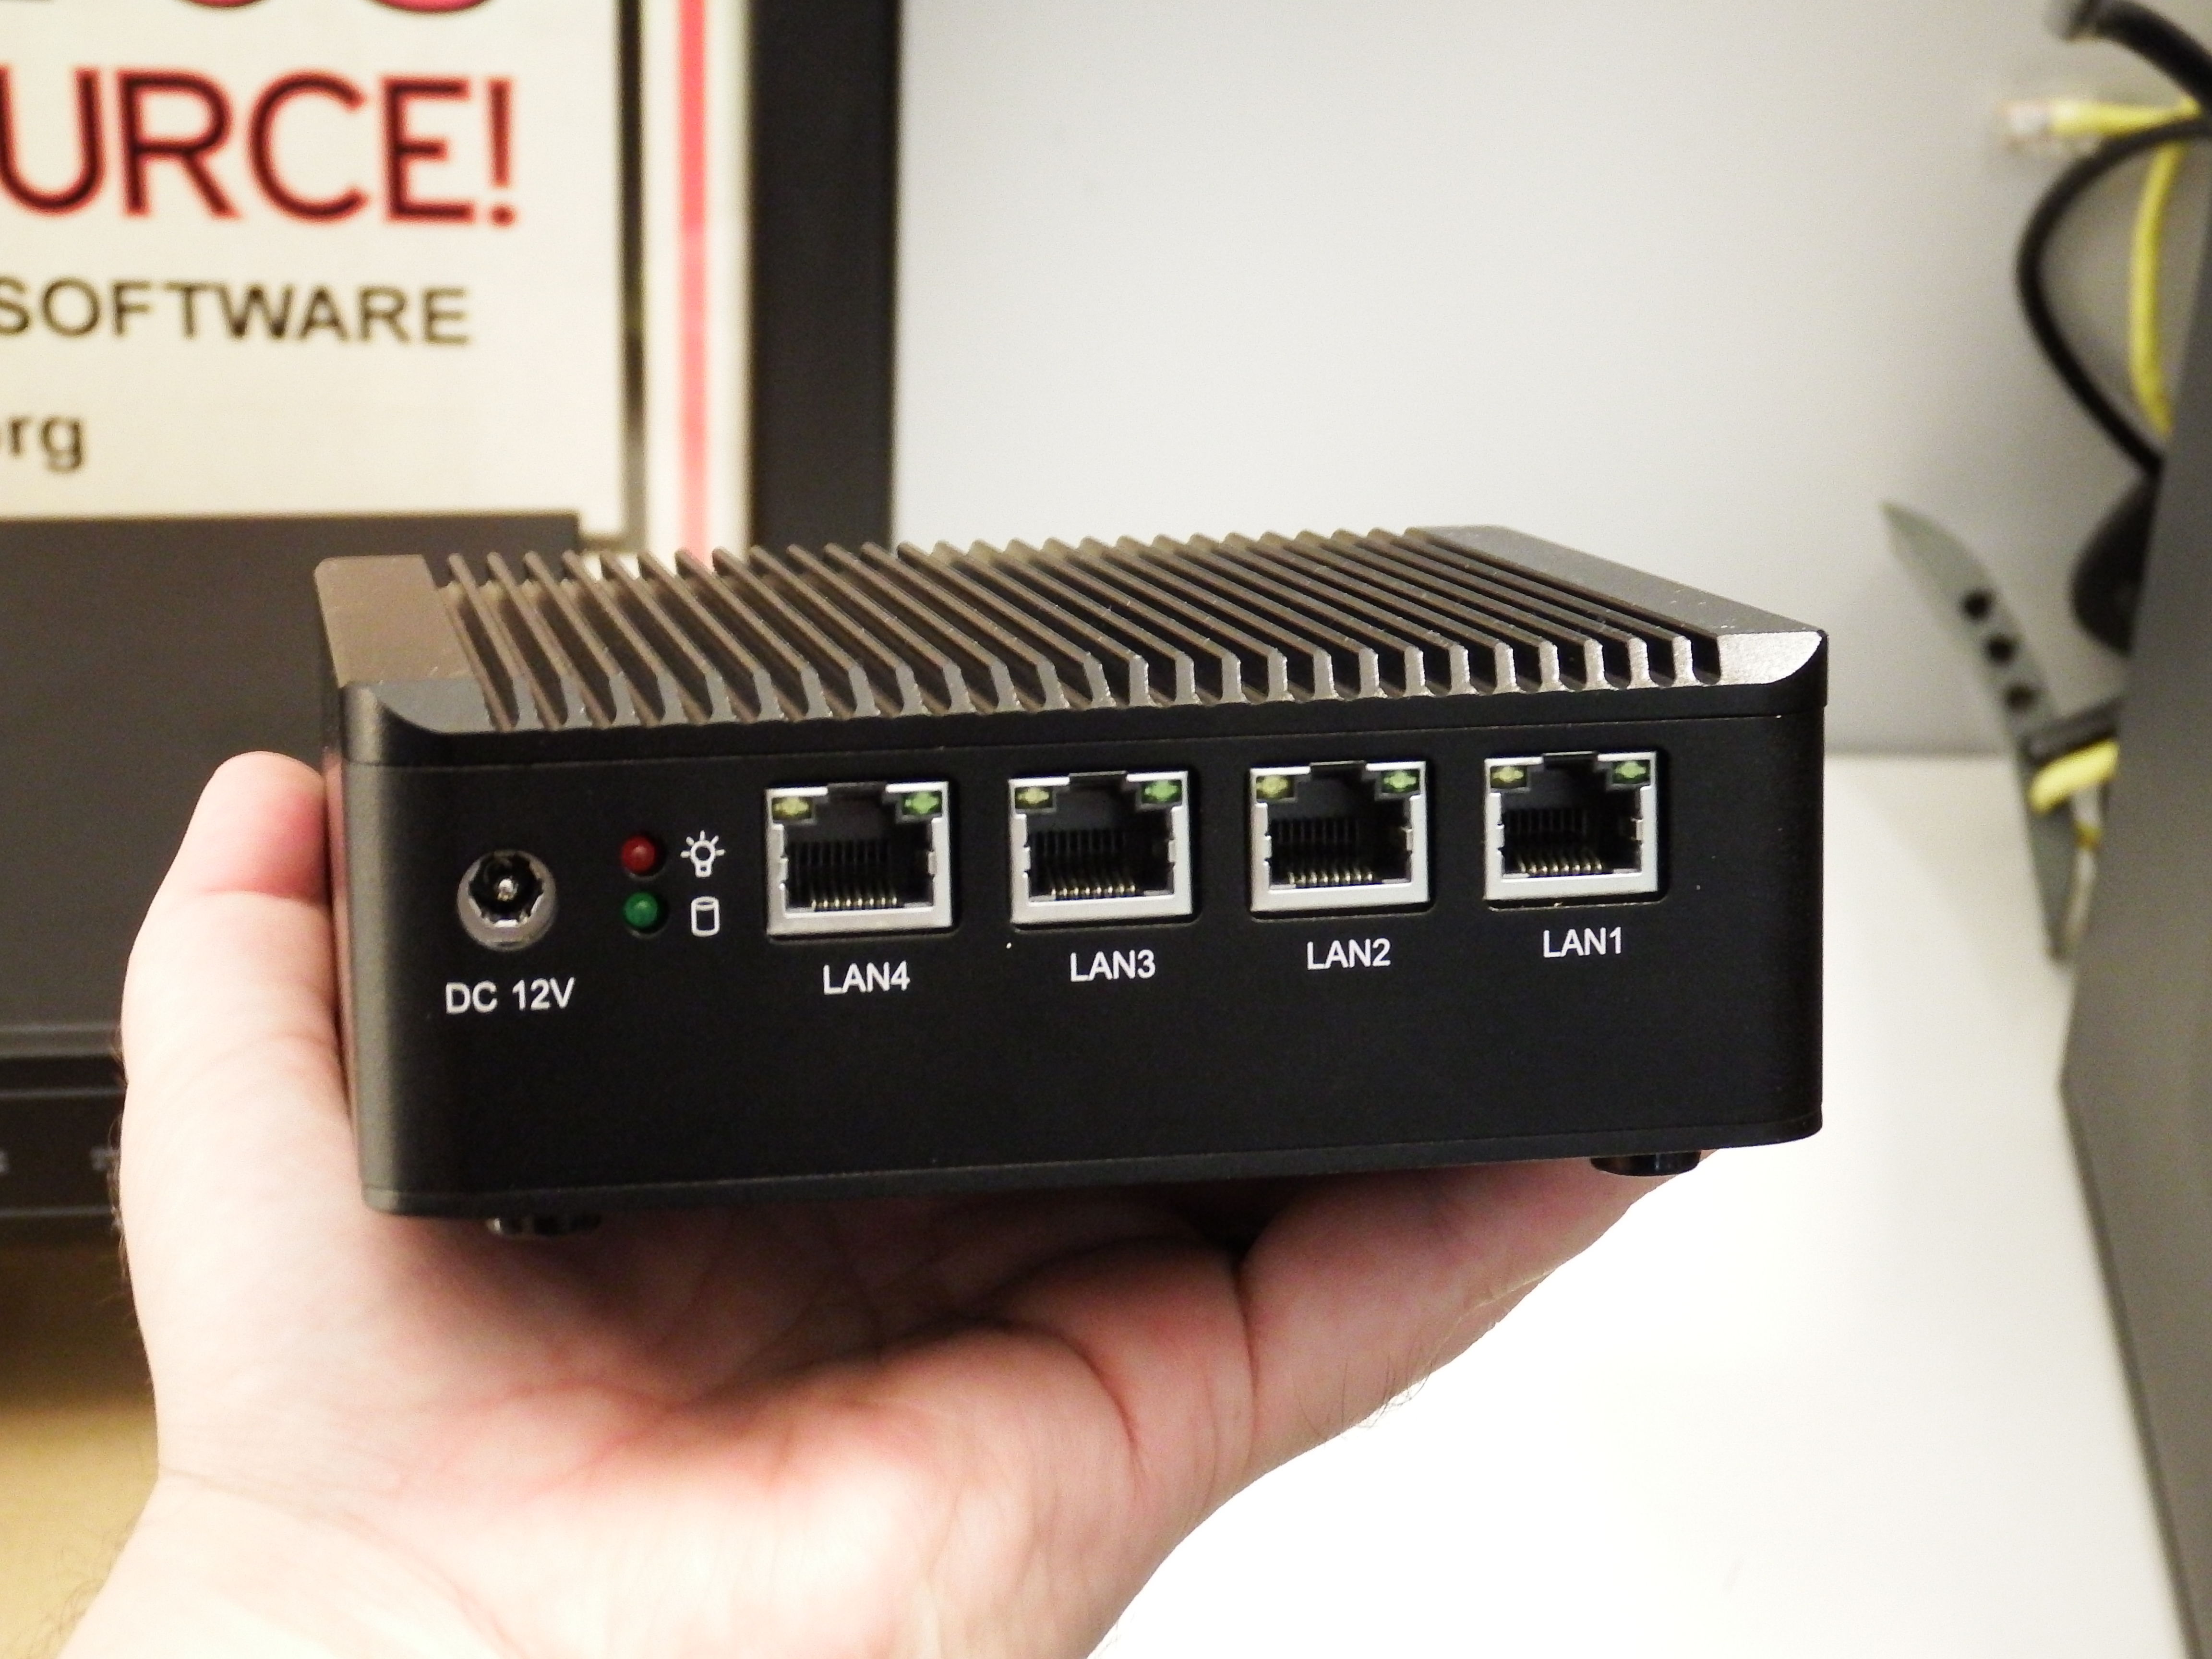
Homebrew 2.0 looks a lot more serious than its spunky little
disco-colored predecessor; it's got a smaller form factor, rugged heavy
heat dissipation fins along the top, and four
Intel gigabit LAN interfaces across the front. It also has a newer
processor: a J1900 Bay Trail Celeron, as opposed to the original
Homebrew's 1037u Ivy Bridge Celeron. The new CPU is a mixed bag. It's
got twice the cores, but it's a bit slower per thread. For most routing
jobs, this gives the older Ivy Bridge CPU a slight advantage, but overall it's a wash. Either version has proven to be more than enough muscle to do the job.
The new build is considerably simpler and a
little cheaper to source than the original; it's a Qotom barebones PC
sold via Amazon.com. They do still ship from China, so don't expect
Prime shipping, but in my experience Qotom has been quick to ship and
quick to respond to problems if any arise. The total cost of this
build—with the mini-PC itself, an 8G stick of RAM, and a 120G Kingston
solid state drive—was around $240.
Of course, the physical box isn't the
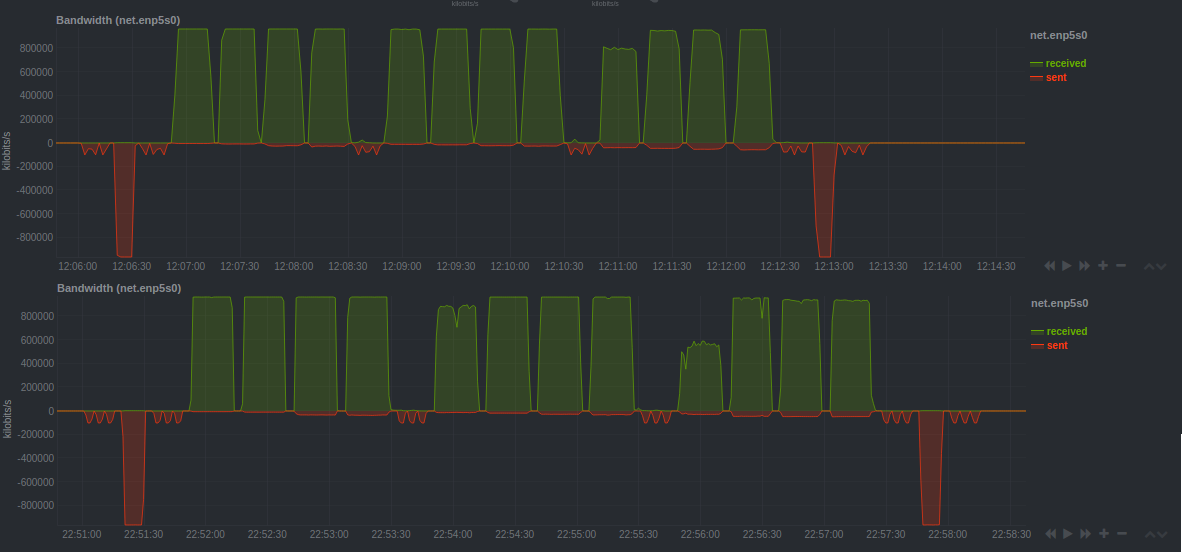
story—let's move on to its performance. The direct switched performance
is at the top, the Homebrew 2's is at the bottom.
Enlarge/ This isn't quite as good as it gets... but it's really, really close.
Jim Salter
First of all, don't get thrown by the
horizontal scale mismatch. Netdata is unfortunately a little quirky with
its autoscaling, and I had to settle for that scale not always matching
up precisely. Aside from that, we're not just looking for maximum peak
throughput; we also want to see nice, clean, nearly squared-off
waveforms. Any time you see slow curves or obvious big "nibbles" taken
out of the roof of the tests, that's someplace the router was struggling
a little. A user would experience that as unexpected "glitchiness" in
the real world—stalled or glacially slow connections that you end up
having to restart.
Unsurprisingly, the Homebrew 2 did really
well. The peak output is pretty much identical, the vertical slopes are
sharp, and with a couple of very minor exceptions, the "roofs" are
clean. You only see a visible dip in performance on the 10K/10 clients
test, which is generally the most challenging part of the suite. But at
600mbps+, Homebrew 2 still ain't half bad.
Comments
Post a Comment