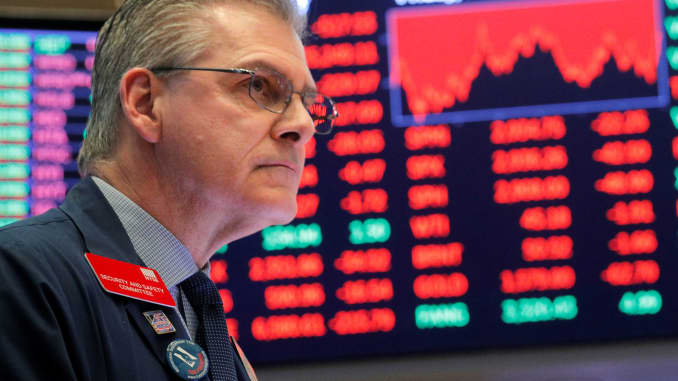
A worker is seen on the floor of the New York Stock Exchange (NYSE) in New York, U.S., February 28, 2020.
Brendan McDermid | Reuters
The stock market doesn’t “wait and see.”
As
much as investors themselves need time to assess the economic effects
of the coronavirus outbreak, the market registers the immediate shock of
a derailed economic-growth outlook and then whips around madly as it
shuttles among all the widely divergent outcomes.
And so, the
S&P 500 — after dropping 12% to end February in the fastest such
correction on record — last week went screaming in both directions,
alternating quicksilver rallies with urgent selloffs in the most
volatile action since the 2011 panic over a feared U.S. debt default and
European credit crisis.
A week ago here, my call was that “the
tape is becoming stressed and stretched in a way that tends to precede
the kind of reflex rally that is sudden, powerful and probably
untrustworthy.” That roughly played out, with Monday’s huge 4.6% S&P
500 rally giving way to severe chop that wore away just about all that
daily gain.
Here is the S&P 500 over the past decade along
with the average ten-day daily price change, plotted by SunTrust. Such
violently fibrillating periods tend to occur after the initial flush
lower in a correction, though often with more weakness lurking out
ahead.
While such mercurial action might seem confused or
irrational, it can be seen as the market relentlessly hunting for buyers
and sellers with conviction about the outlook. In a time when the
market’s trend buckles and the range of outcomes runs from
brief pause in economic growth as the virus is contained to
open-ended pandemic and recession, prices need to move farther, faster, to locate those high-conviction investors.
As
Kevin Dempter, a strategist at Renaissance Macro Research, puts it,
“The market has seen extreme whipsaws as it’s been desperately trying to
form a new trading range.” This has been the course followed the prior
times the past decade when a sudden downturn pushed the
CBOE S&P 500 Volatility Index up toward 50, as it did recently.
“Extreme
daily whipsaws should eventually ease as the range tightens,” he says.
“In these times of extreme uncertainty, the potential for range-bound
consolidation is welcomed as it at least gives investors some clarity on
important market levels to help manage risk.”
In other words, in such times, sideways movement represents progress.
A
flattish week in stocks with Treasury yield rushing to stunning new
lows below 0.7% appears a tentative, fragile equilibrium at best. The
VIX finishing the week in the 40s and gauges of credit-risk showing
escalating stress by week’s end make it hard to declare the fever is
passed.
The way ahead can be viewed as a series of tests:
•
In the typical market-correction playbook, a significant low in the
indexes, formed with a dramatic reversal, usually is tested within weeks
or months. For the S&P 500, this level is around 2855, the low from
the afternoon of Feb. 28, where a furious rebound rally began on heavy
volume.
Ideally, a retest should return to or near that low and
show less selling intensity (fewer stocks making new lows, lesser
trading volume), in which case traders can start to view it as a
presumed bottom. On Friday, the S&P sagged to about 2900, with a
good deal less selling pressure than the week before – perhaps a sign
the bears had done enough for now, if not a robust retest. In the 2011
tailspin and the early 2018 drop, a retest two months later found
footing at slightly lower levels that the initial tumble.
Of
course, not all retests are passed. The initial double-digit drop in
2018 from a September all-time high, stocks bounced hard and it looked
like a retest setup, only to give way to a more disorderly selloff and
ultimate 20% loss that December, before a furious recovery took hold.
•
Wall Street also needs to be tested for resilience to the inevitable
barrage of incremental coronavirus headlines – daily infection counts,
cities curtailing activities, businesses restricting travel.
The
market storm won’t abate when the outbreak seems contained to everyone’s
satisfaction. It will be over once securities get priced to a level
that reflects a serious set of outcomes and then stop responding to what
everyone expects to be a widening radius of infection and business
disruption.
It’s unclear this point has been reached.
•
The alarming collapse in Treasury yields is also testing investors’
long-held ideas about how to value stocks. This correction began from a
moment of rich valuations that were dependent on a series of positive
things happening: global economic reacceleration, rebound in corporate
profits and a Fed benignly holding policy steady.
Is a 12% drop
from such levels enough to account for the rising possibility of
flat-or-worse earnings and severe consumer retrenchment?
Investors
typically argue that equity valuations can be higher when bond yields
are lower. Yet with yields scraping toward zero, this math grows
tenuous. Could stock valuations in Europe and Japan be infinite with
yields below zero?
Or do the conditions that cause yields to
approach zero mean the backdrop is inherently less friendly for
corporate fortunes and stock values?
Goldman Sachs plots the
so-called equity risk premium, or the gap between the earnings yield on
S&P 500 (earnings divided by price) and the 10-year Treasury yield.
It
now shows equities to be as attractively valued on this basis as
they’ve been since 2014 or so — even more so than on the chart, now that
Treasuries are below 1%. Not bad — unless this approach loses validity
at the extremes of the interest-rate spectrum, and the factors driving
down rates also make those earnings forecasts suspect.

Comments
Post a Comment